Honoring Excellence in Robotics: Matthew T. Mason Awarded the Prestigious AAAS Fellowship
Matthew T. Mason, PhD, has been elected a Fellow of the …

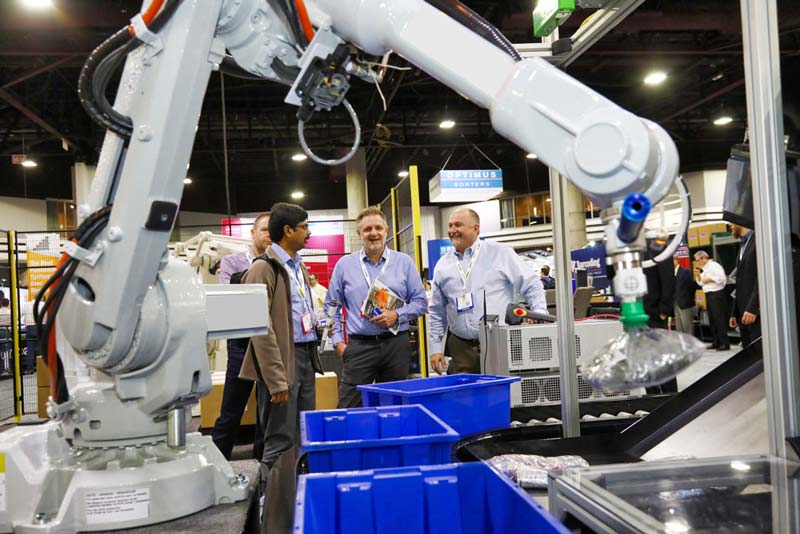
Do you attend a lot of industrial-automation trade shows? If so, you likely recall seeing robotic tote picking systems displayed with stickers touting performance rates that seem high to you given your professional experience. Often these numbers represent “machine potential” or close approximations thereof. If you step back and manually time the systems you are observing, you may also see numbers that seem unusually high. In some cases, demonstration systems are orchestrated system-wise and SKU-picking-wise to produce the highest possible rates and of course are run under pristine conditions such as well-lit demonstration halls with perfectly clean items to process, perfect packaging on the items, and a relatively benign set of SKUs to begin with. These are not the conditions you find in your typical distribution centers.
Let’s talk about machine potential, overly optimistic numbers, and how one might think about system performance numbers. Machine potential can be defined as the fastest possible rate that a machine would produce under optimal conditions. It can also be thought of as the upper bound on the possible throughput rate. With robotic tote picking, for example, one might calculate the potential according to the amount of time required to transfer a hypothetical item from point A to point B – one would similarly ignore any possible slowdowns caused by, for instance, ASRS tote presentation rates or conveyor belts that are not perfectly loaded (and thus must be advanced regularly to present SKUs to the robot). Ignoring these items, which generate variability, enables one to get a sense for upper bound or potential of the basic underlying system, i.e., its machine potential. However it is non-sensical to treat that single number as a “reliable” proxy for the throughput buyers of the system can expect in their nuanced environments under very diverse operating conditions and with a wide range of items to be picked, presentation models, and so forth. Unfortunately for our industry, machine potential and similarly overly optimistic assessments based on machine potential are often offered to customers as numbers they can expect to see throughput-wise.
Let’s look into this further – and provide you with a few thoughts as to how to work around machine potential or overly optimistic sales tactics when evaluating a solution.
Imagine a robotic picker is a car. Under ideal conditions, the car can go 200 mph, so the manufacturer cites that as the “machine potential.” But what does that number mean to you as a potential car buyer? Achieving that speed requires an optimal setting between the start and goal of the drive: a straight path on smooth terrain in good weather. You must be able to drive that fast (for example, with no other downstream, slower-moving cars or issues with speed limits). Therefore, you can’t really use that machine-potential number to determine how long it’s going to take you to drive to work every day. In business-speak, your “use case” doesn’t really align with the conditions to which that machine-potential number applies.
I don’t know about you, but I don’t pay much attention to the machine-potential number when buying a new $30,000+ automobile. So, why does machine potential prevail as a reliable measurement for robotic automation buyers who are shelling out hundreds of thousands of dollars (or possibly more)?

Many vendors do not understand all the de-rating factors when determining total throughput per day as they just don’t understand the entire upstream and downstream processes of the system. So instead they just usually cite the “machine potential.” And the rest follow suit.
Machine potential cited by automation vendors is generally computed based on the system performing under perfect conditions. The perfect conditions are then presented in the demo system on the show floor. But does your process match that exactly? Does your ASRS use the same exact totes? Are your totes right next to each other, lip-to-lip on a clean tabletop under perfect lighting (like in that demo or YouTube video you just watched)?
Savvy enterprises understand this. They know automating is the right path and do the best they can to optimize throughput with the understanding that the machine potential is a pipe dream. They have the experience and wherewithal to de-rate the machine potential based on their process, and to determine that the conservatively de-rated performance provides value.
Many experienced businesses continue to fall into the trap of believing vendor-stated machine potential numbers. Why?
As a start, I’d pose the following questions to an experienced retailer:
• Do you have an ASRS (or any other piece of automation)?
• Does it hit the advertised machine potential?
• Under what conditions?
• How often does your process present those conditions?
• Have you ever seen it happen?
To sum up: Machine potential depends on a lot of specific variables in use cases. Without knowing all the variables that contributed to that vendor-stated machine potential, you cannot reliably apply that machine potential rating when calculating throughput in your own use case if you were to buy.
Here’s some things to keep in mind as you watch that robotic tote picking-system demo, to help you get to a more-reliable number.
Brownfield or greenfield: Is your DC brownfield or greenfield (e.g., an ASRS goods-to-person system vs. one that’s vendor-designed and optimized)? A vendor-designed pick system could enable better throughput because it’s designed for a robot use case, while a goods-to-person system is designed for humans not robots. (Robots like different layouts.)
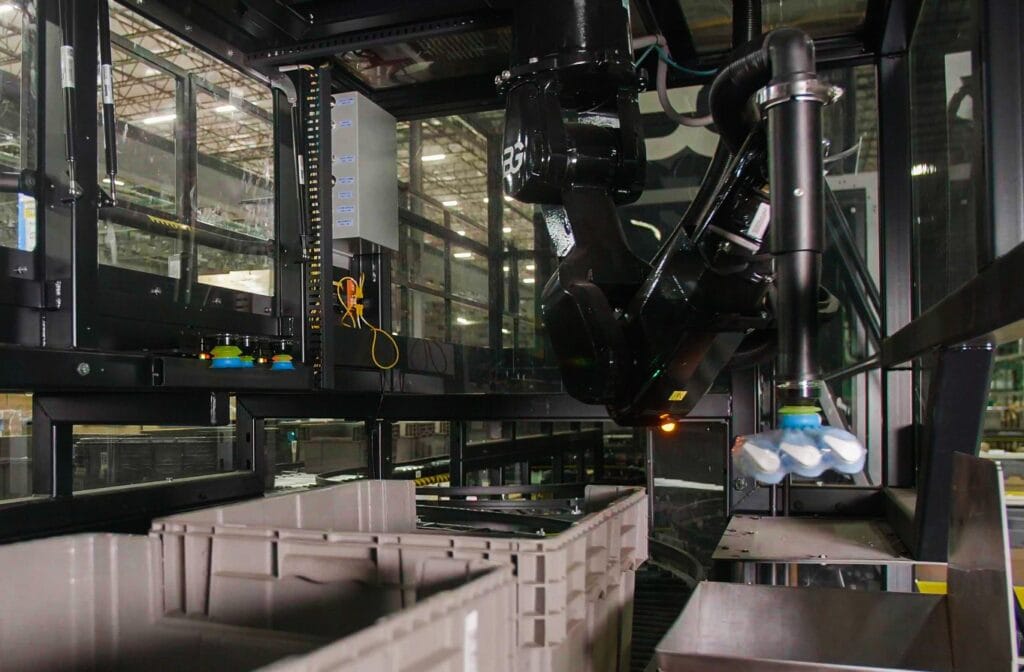
Distance: How far does an item need to be transferred (the distance between pick and place)? Does it need to travel side to side, or up and over? Demos typically have bins side by side, but it’s very rare to find this in the wild.
What are your maximum and minimum payload dimensions and weights? Does your packaging open up or is it poorly sealed? Your throughput will move faster for lightweight or rigid items, while requiring longer motions for larger payloads.
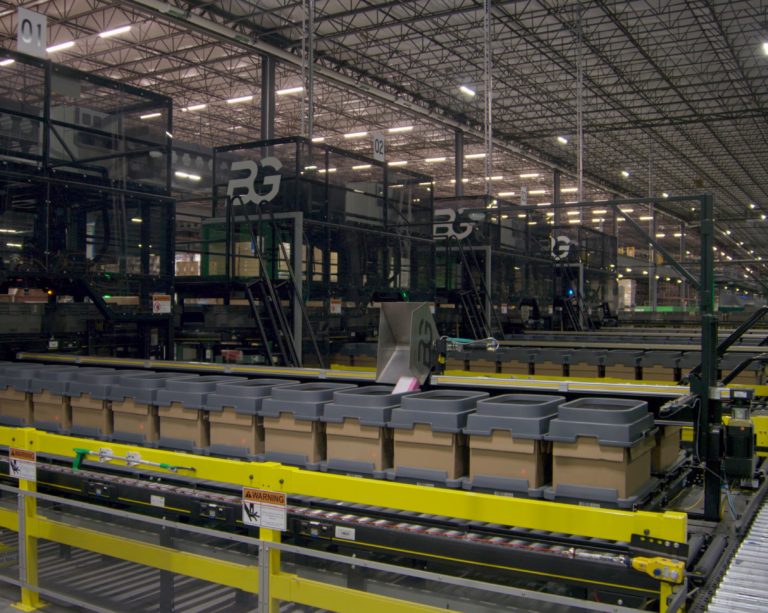
Pick region definition: Totes or conveyor belt? (Lifting from totes takes more time.) Total depth of totes? (Short totes enable a shallow arc of movement for lifting). Demos have short totes, but no one uses an ASRS with very short totes because of their reduced capacity.
Volume of pick region: Volume requires a larger robot, which is generally slower.
Packing density: How many items are present in your pick region at once? More items mean more perception work, leading to more segmentation and more grasp calculations. How are items oriented? Are they oriented in a way that makes it difficult to compute grasps?
Cleanliness: Do totes contain trash that may affect picking times? (I’ve never seen trash in a demo tote yet trash is a fact of life in production totes.)
Divided totes: Picking from division may require longer motions.
Do you have items requiring gentle or soft placement? If so, what’s an acceptable drop height? Do you have an efficient-packing mandate from a customer, dictating a required packing density? How many place regions do you have and at what distance from each pick region, for example in a put-wall situation?
What’s your acceptable damage rate? Can you trade off throughput for damage—for example, can you throw items? What’s your accuracy rate? Can you trade off throughput for accuracy?
How many interactions do you have between automation components? It’s difficult to model handoff time, such as non-zero time between conveyor and shuttle. There’s also item-falling time (the time it takes for an item to fall into place after releasing it) and out-of-sync components—for example, when a robot must wait for a mobile robot.
Finally, there are also infeed rates and outbound rates to consider. (More on this below.)
Congratulations. The manufacturer claimed to have provided a machine potential rating for your exact application (or so you think). But don’t rush to factor that number into your process-throughput calculations, as you may still not see that when it’s on your distribution-center floor. Your facility’s process must facilitate the equipment’s average throughput to approach machine potential.
Here are a few more things to think about.
Charging delays in the infeed mechanism to a robot can slow things down. Slower processes upstream of the robot will make the robot wait.
The distribution of number of picks per presentation is another factor. For example, in ecommerce, it’s very common to have one pick per inventory tote that requires many presentations, which can slow down the system.
Finally, even if all processes upstream of the robot are fast “enough,” problems arise.
For example:
Can the robot be mid-item-transfer while the next tote to be picked is being scanned and segmented? If the layout doesn’t allow it, then expect delays.
Can the presentation delay be pipelined given the process or do you have to eat the entire tote removal and tote presentation time?
Outbound delays: Slower processes downstream of the robot will make it wait.
Distribution of destination assignments can affect one-to-one systems (robot -> shuttle/bomb bay) more than it affects one-to-many systems (robot->pigeonhole in put wall).
Closer destinations vs. further destinations affect delays, or the same fixed destination fills up fast, requiring it to be emptied before work continues. For example: a robot has to wait for humans to empty pigeonholes for a new one to become available. Or wait for the boxing machine to finish boxing. Outbound inventory totes get backed up downstream because the ASRS can’t infeed them fast enough, so new inventory totes can’t be accepted.
Finally, are there humans in the process? Do they all perform the same way? Human performance might vary greatly, and this is true for both upstream and downstream human workers. More variance makes it harder to strategize. Automation might have more consistent performance.
Getting to a true understanding of your expected throughput can be complex. But there’s undoubtedly a much better way to get there.
I’ll leave you with three pieces of advice:
• Take no machine potential number at face value. Have a detailed engineering discussion with your automation vendor to compute a more-realistic expected rate of throughput.
• Keep in mind that a system with a lower machine potential rating may perform better on average than a system with a higher machine potential.
• If your vendor isn’t willing to roll up their sleeves on your details now and put their money where they claim their throughput is, you may want to think again.
About the Author

Ben Cohen is an expert robotics engineer at Berkshire Grey. Ben earned his Ph.D. in computer science at the University of Pennsylvania where he was a member of the GRASP lab. Ben’s research focused on motion planning for robotic manipulation as a member of Max Likhachev’s group. He earned his B.S. in computer engineering at Binghamton University.
Matthew T. Mason, PhD, has been elected a Fellow of the …
Berkshire Grey’s founders – experts in robotics, industrial automation, and artificial …
Robotics as a service is a business model that enables subscription-based …

Reduce chain-wide inventory, replenish just-in-time, and streamline operations.
Smart Store Replenishment
Package sortation saves time and money at every node in the supply chain.
Dynamic Package Sortation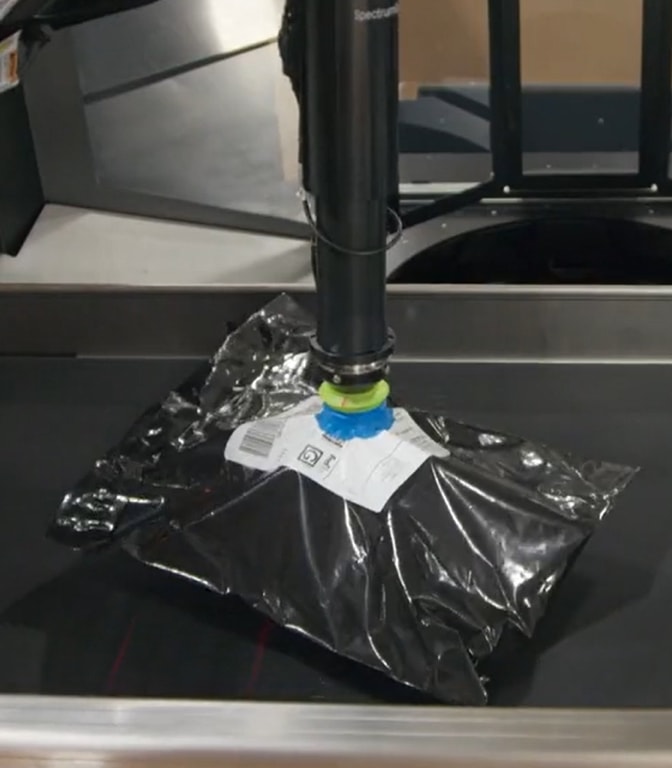
Contact the BG Fulfillment Automation Sales Engineering Team to Learn How to:
Call +1 (833) 848-9900
or connect using our form.